Two Economies, Two Markets: Comparing India and the UK’s Market Resilience

Nathan Samuel
In the past decade, the global financial markets have faced significant turbulence and volatility. Many have paid close attention to how different markets have responded to these economic shocks, especially in the emerging versus developed economies. This analysis aims to compare the performance of the Indian stock market (emerging economy) to the UK stock market (developed economy) through the comparative analysis between three major financial indices: the United Kingdom’s FTSE 100; and India’s NIFTY 50 and BSE SENSEX over a 10 year period.
This study aims to identify how each market responded to major global events, such as Brexit, COVID-19, US rate hike and the Ukraine war. Furthermore, it explores the relationships between the markets by using methods such as beta coefficients, correlation and regression models to understand any predictive potential. It is hoped that this analysis may highlight the vulnerabilities and comparative strengths of the Indian and UK stock markets alongside offering insights into investment strategy for investors and financial institutions.
Market Performance Trends
Over the studied 10-year period, the NIFTY50 and BSE SENSEX showed strong growth with a CAGR of 10.15% and 10.35% respectively, which contrasts to the FTSE 100 with a CAGR of 1.93% indicative of much slower growth. This is likely due to the Indian economy being a developing one, leading to more rapid economic growth.
The annualised volatility for the FTSE 100 over the 10-year period was 12.1%, which was lower compared to 16.1% for the SENSEX and 16.2% for the NIFTY 50. Once again due to the developing nature of the Indian economy.
Impact of Global Events
The COVID-19 outbreak in early 2020 led to a rapid and global market collapse due to the sudden lockdowns worldwide. During the crisis (January 2020-June 2020), growth for all three indices shrank by 15% and volatility increased significantly. However, the Indian stock markets (NIFTY50 and SENSEX) were more resilient in that it took only 9 months to recover to pre-pandemic prices compared to 22 months for FTSE 100.
During Brexit 2016, all three indices shrank by approximately 5% but FTSE100 quickly recovered to 10% growth while the Indian indices continue to shrink. However in the post Brexit phase (2017), both NIFTY50 and SENSEX growth trebled compared to FTSE100 possibly indicating the return of Foreign Institutional Investors (FII) to the market after restabilisation.
The Ukraine war in 2022 led to 2% shrinkage in FTSE growth, in contrast to the Indian indices which grew by 6%. This probably reflects the UK being heavily affected by the higher commodity prices seen in Europe, due to economic sanctions on Russia, which caused recessionary fears for investors. This contrasted to India, who substituted Middle Eastern imports for Russian commodities that were at a discounted price. This may have mitigated the effect of the oil price spikes. In the period post invasion (September 2022-September 2023) all three markets stabilised, with the FTSE growing 10% whilst both of the Indian indices showed more strong growth of 15%.
Across the global events analysed above, each index displayed some common trends. It was a common theme that the NIFTY50 and SENSEX had higher baseline volatility levels probably due to the emerging nature of these markets. This contrasts to the FTSE100, which had lower baseline volatility rates. This is probably due to the UK economy being a more economically developed country leading to a more stable market. However, this emerging nature of the Indian markets has led to higher levels of growth compared to the FTSE 100.
Inter-Market Relationships and Predictive Modelling
The NIFTY 50 and the SENSEX move almost in lockstep, with a correlation of 0.9841 a near-perfect relationship that’s also statistically significant (p-value: 1.23 × 10-89). This makes sense as both indices include many of the same companies and represent similar sectors of the Indian stock market.
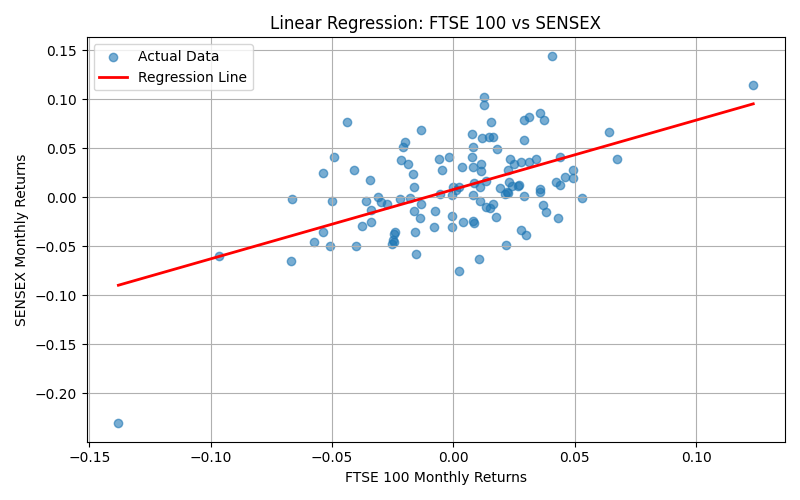
By contrast, the FTSE 100 shows only a moderate connection with Indian indices; its correlation with the NIFTY 50 is 0.5217, and with the SENSEX, 0.5309. This means that while they tend to move in the same direction, the relationship isn’t particularly strong. The difference likely comes from what these indices represent: the FTSE 100 focuses on large multinational firms based in the UK, whereas the NIFTY 50 and SENSEX mostly track India’s major domestic companies.
To see if movements in the UK’s FTSE 100 index could help predict what happens in India’s stock markets, specifically the NIFTY and SENSEX. To do this, we looked at how daily returns in the FTSE relate to returns in the Indian indices using a simple statistical method called linear regression.
The analysis found that when the FTSE doesn’t move, the Indian markets still tend to rise slightly by about 1%. When the FTSE goes up or down, the Indian indices also tend to move in the same direction, but not as strongly. For every 1% change in the FTSE, the NIFTY and SENSEX move roughly 0.7%.
However, the connection is only partial. The results show that around 28% of the daily movements in India’s stock markets can be linked to what happens in the FTSE. The remaining 72% of the changes are likely driven by other factors, like foreign investor flows and policies from the Reserve Bank of India. In other words, while the UK market has some influence, most of the action in India is determined by domestic factors.

Conclusion
This analysis contrasts the various stock market metrics of an established economy (UK FTSE100) against an emerging economy (Indian NIFTY50 and BSE SENSEX) with Indian indices consistently outperforming the FTSE 100 in risk-adjusted returns in the longer term despite its increased volatility during macroeconomic incidents.
As international economic times evolve, geographical diversification of the portfolio with risk assessment and return between places will remain a profitable and essential investment strategy. This study has verified the value of risk-aware and data-driven analysis to invest in today's interconnected global markets.


Comments ()